Our Wireless Health Assessment service ensures your company is getting the most out of its WiFi Infrastructure. We perform a complete end-to-end review of your wireless network architecture highlighting any RF and infrastructure issues before they become a problem. Our Wireless Health Check is customisable based on your specific needs. Your company can either choose to assess one, a few, or all of the wireless health assessments.
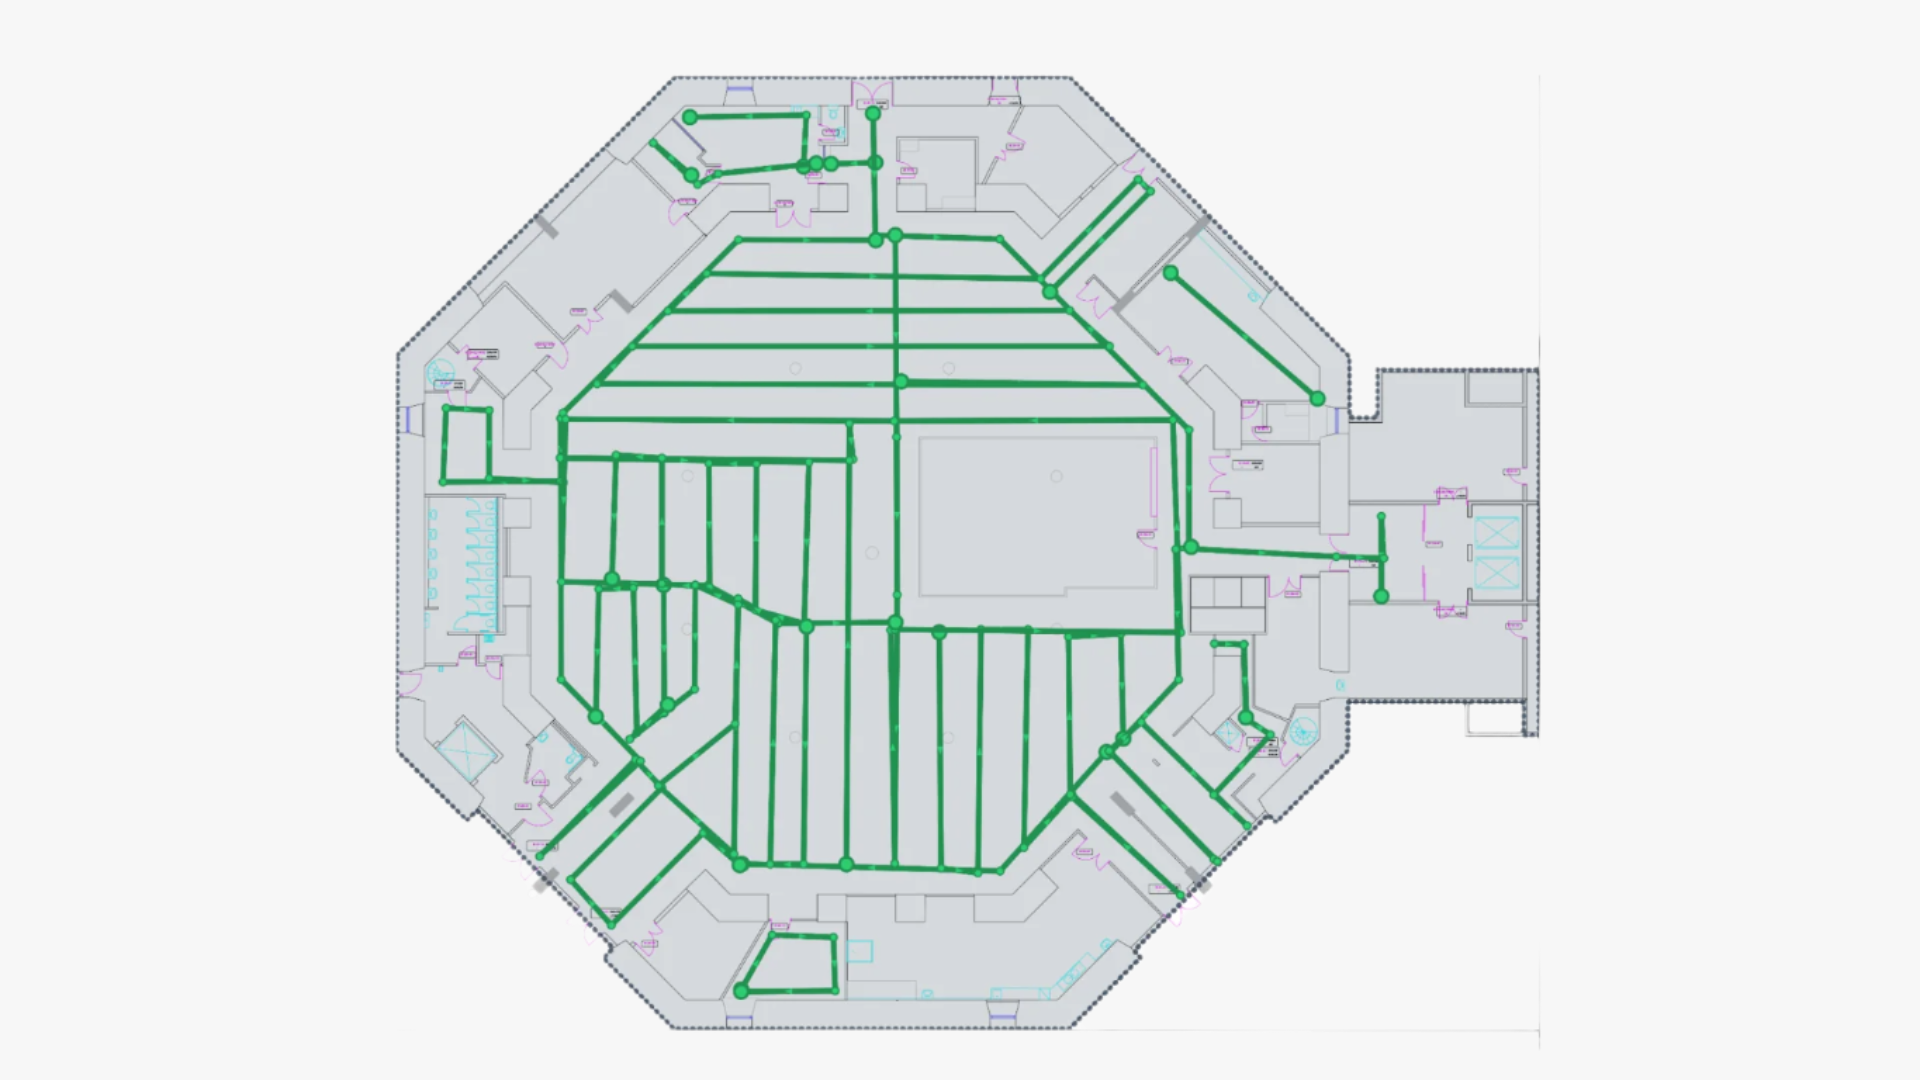
Survey Route
The assessment begins by mapping out a detailed survey route to ensure comprehensive coverage of the wireless environment.
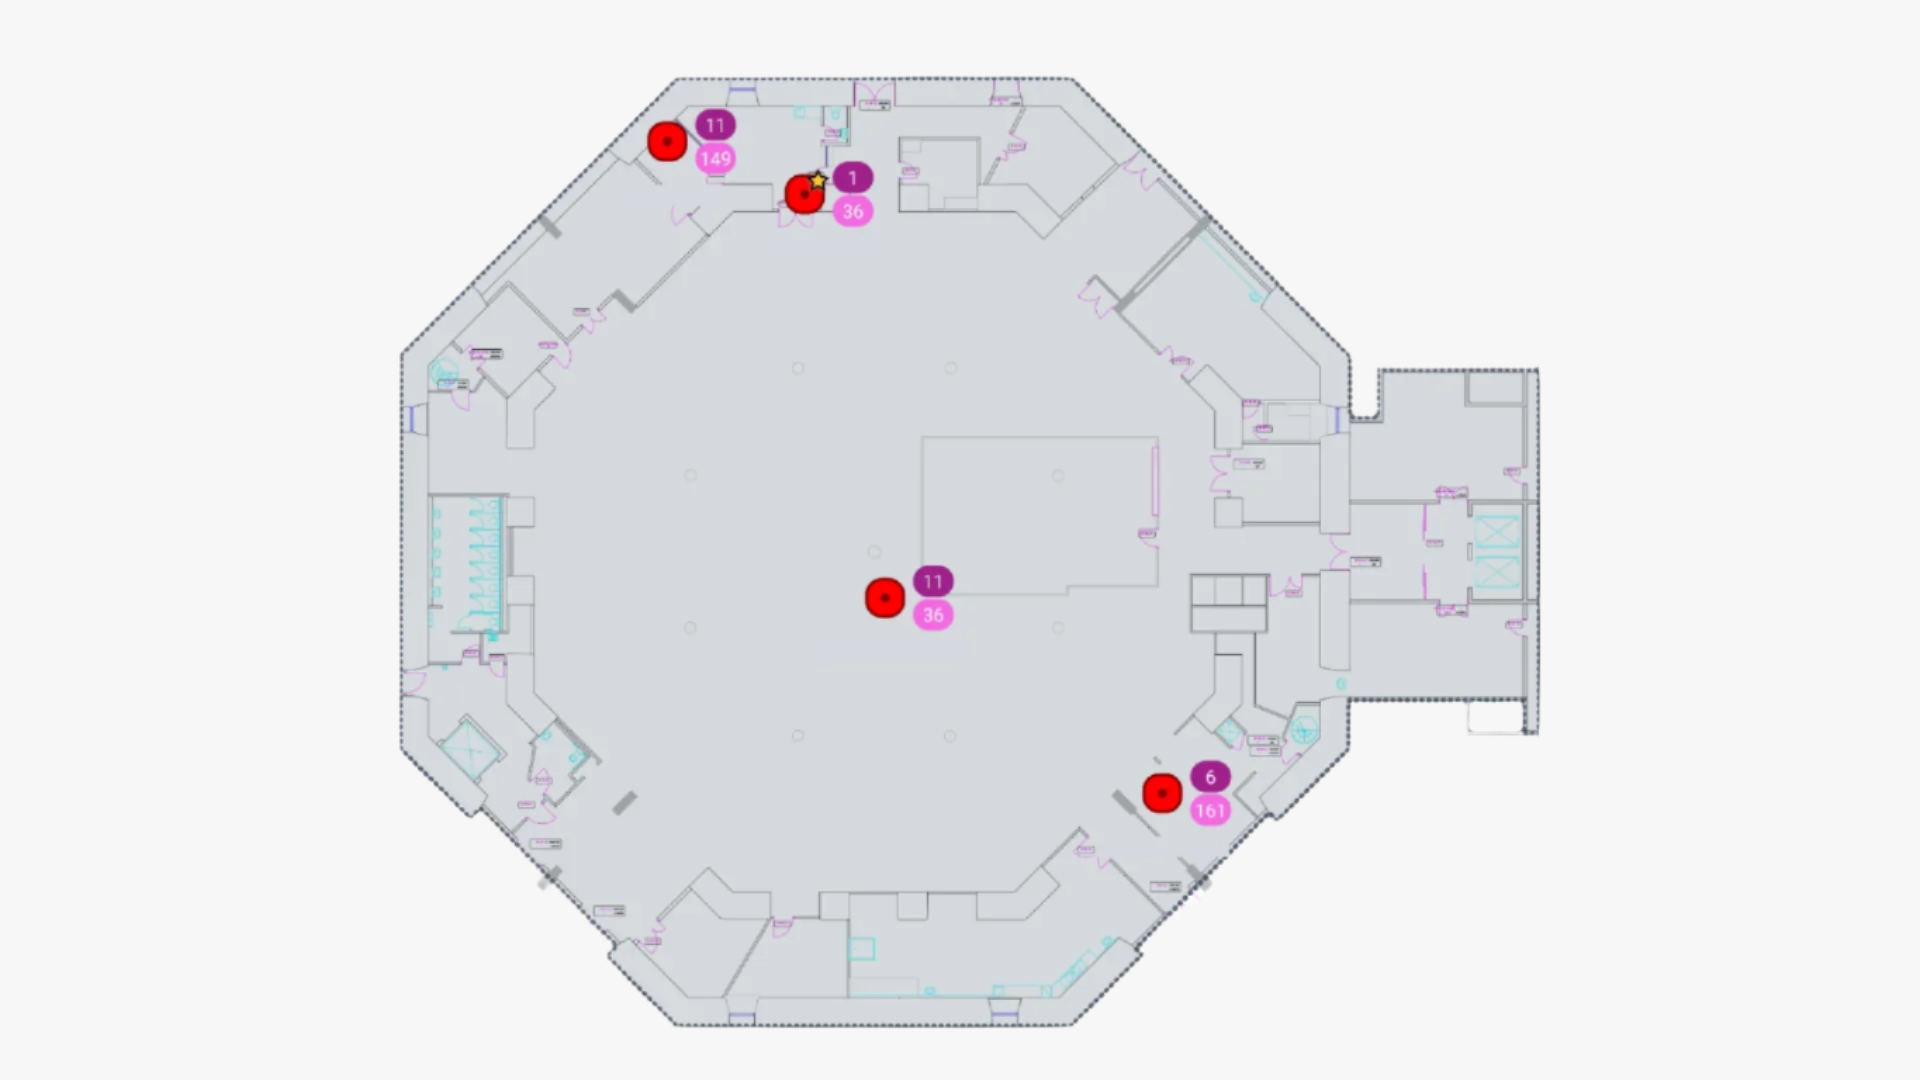
Identified WAPs
The placement and configuration of wireless access points (WAPs) are documented.
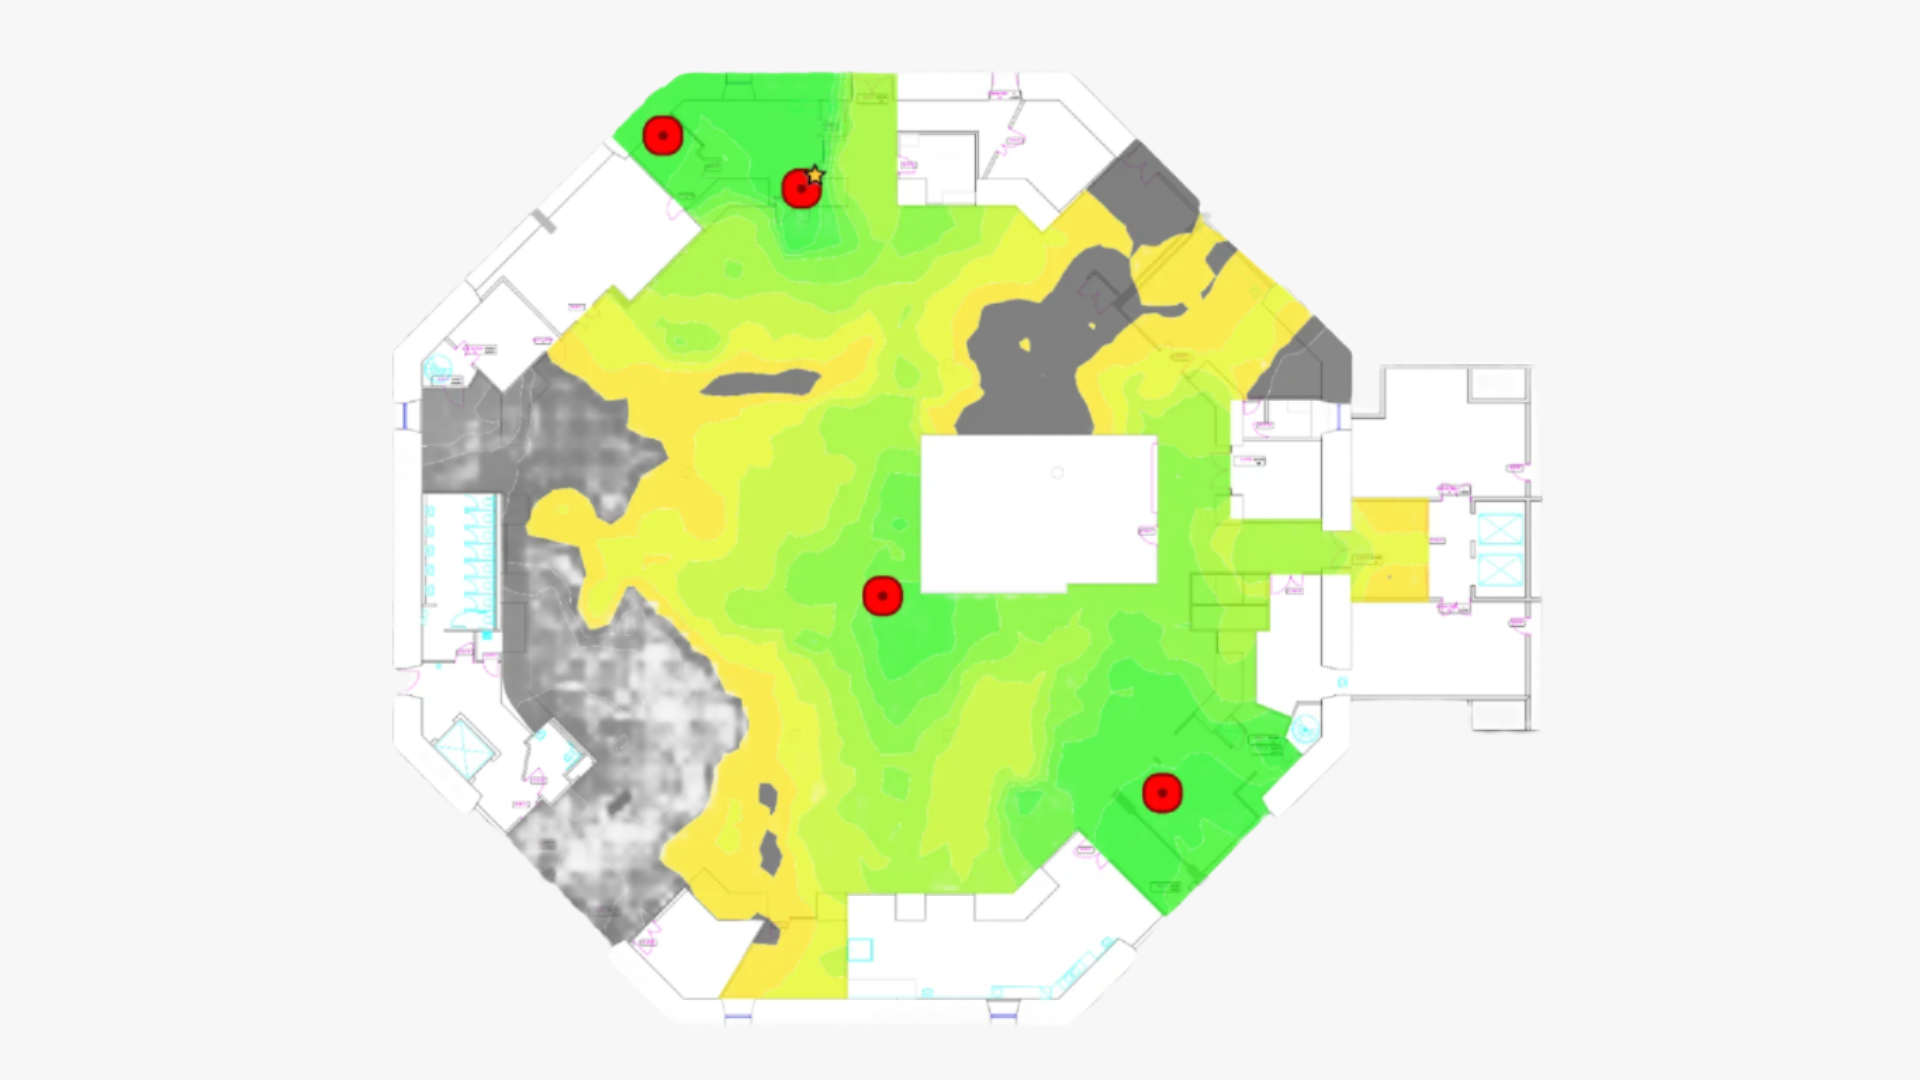
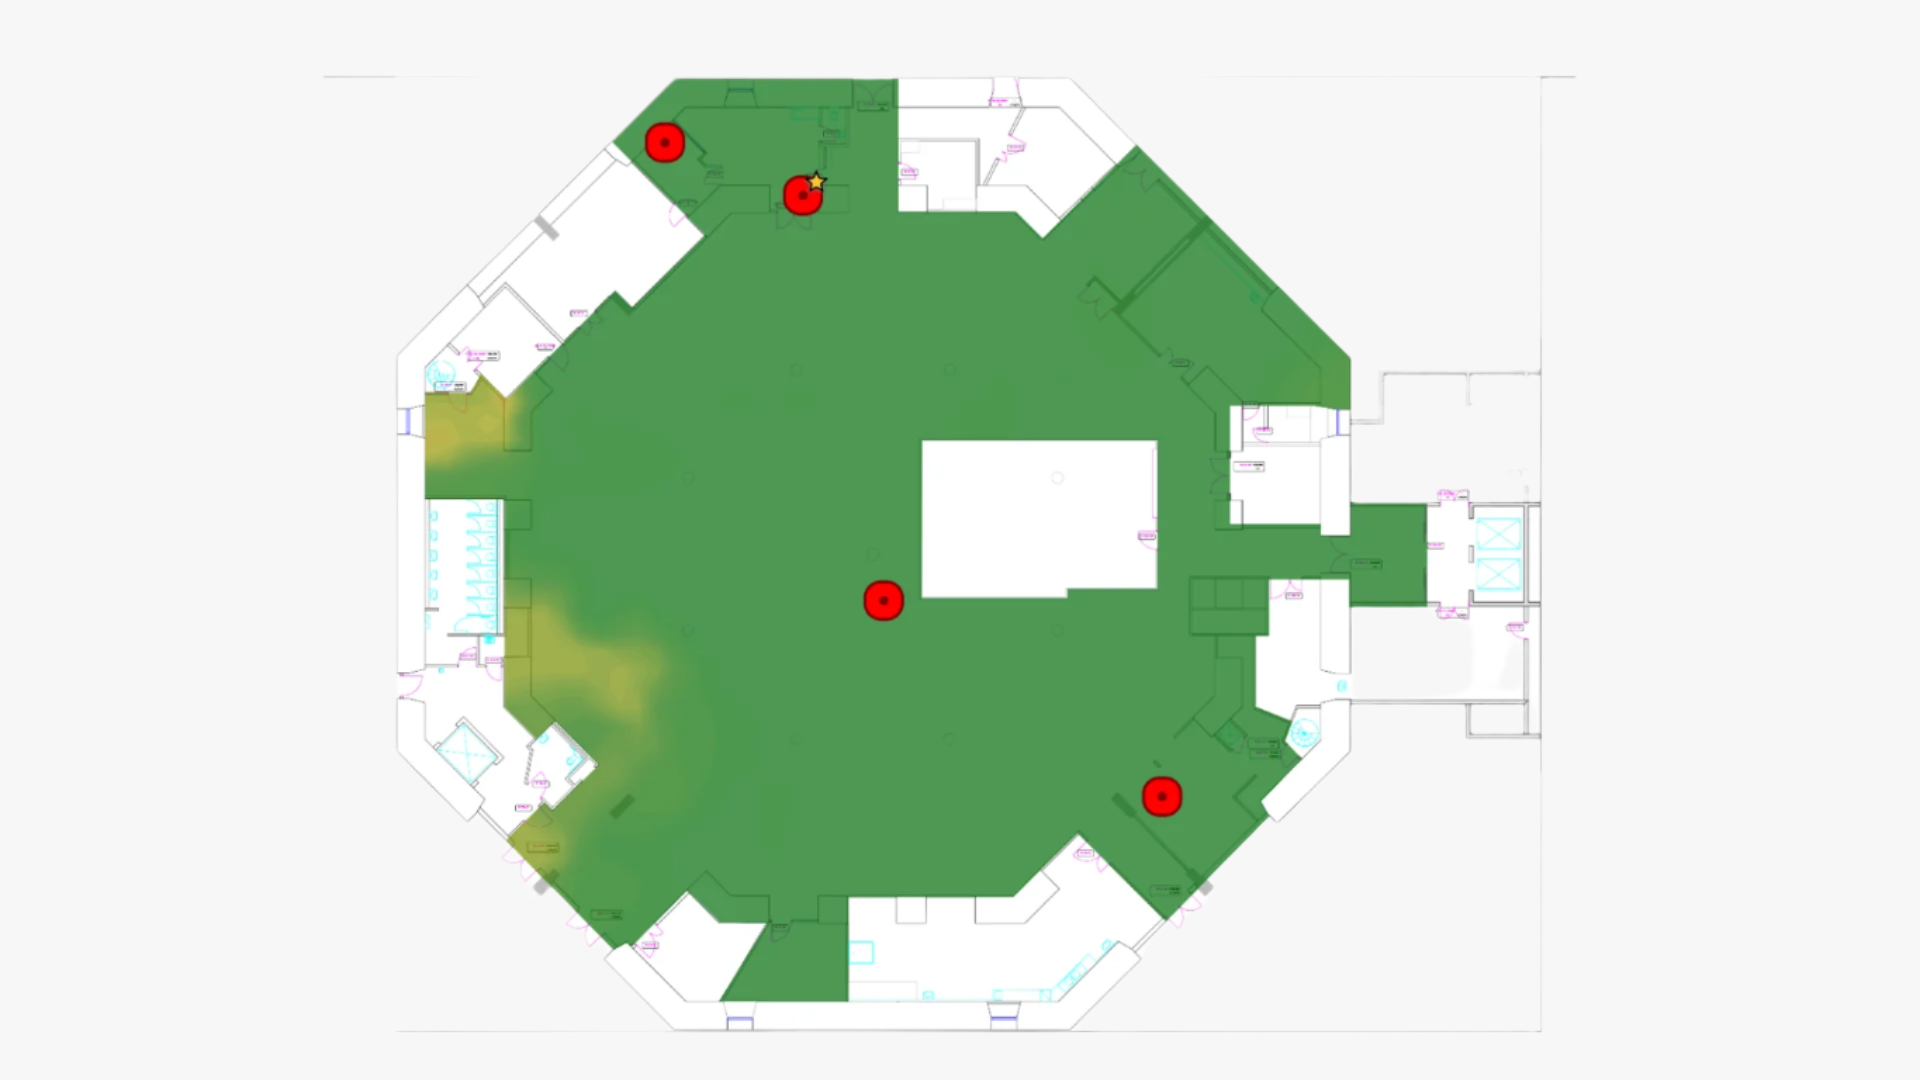
Signal Strength
Signal Strength is referred to as coverage, is the basic requirement for wireless network performance.
Low signal levels contribute to unreliable connections and low data throughput. We measure at 2.4, 5, 6GHz.
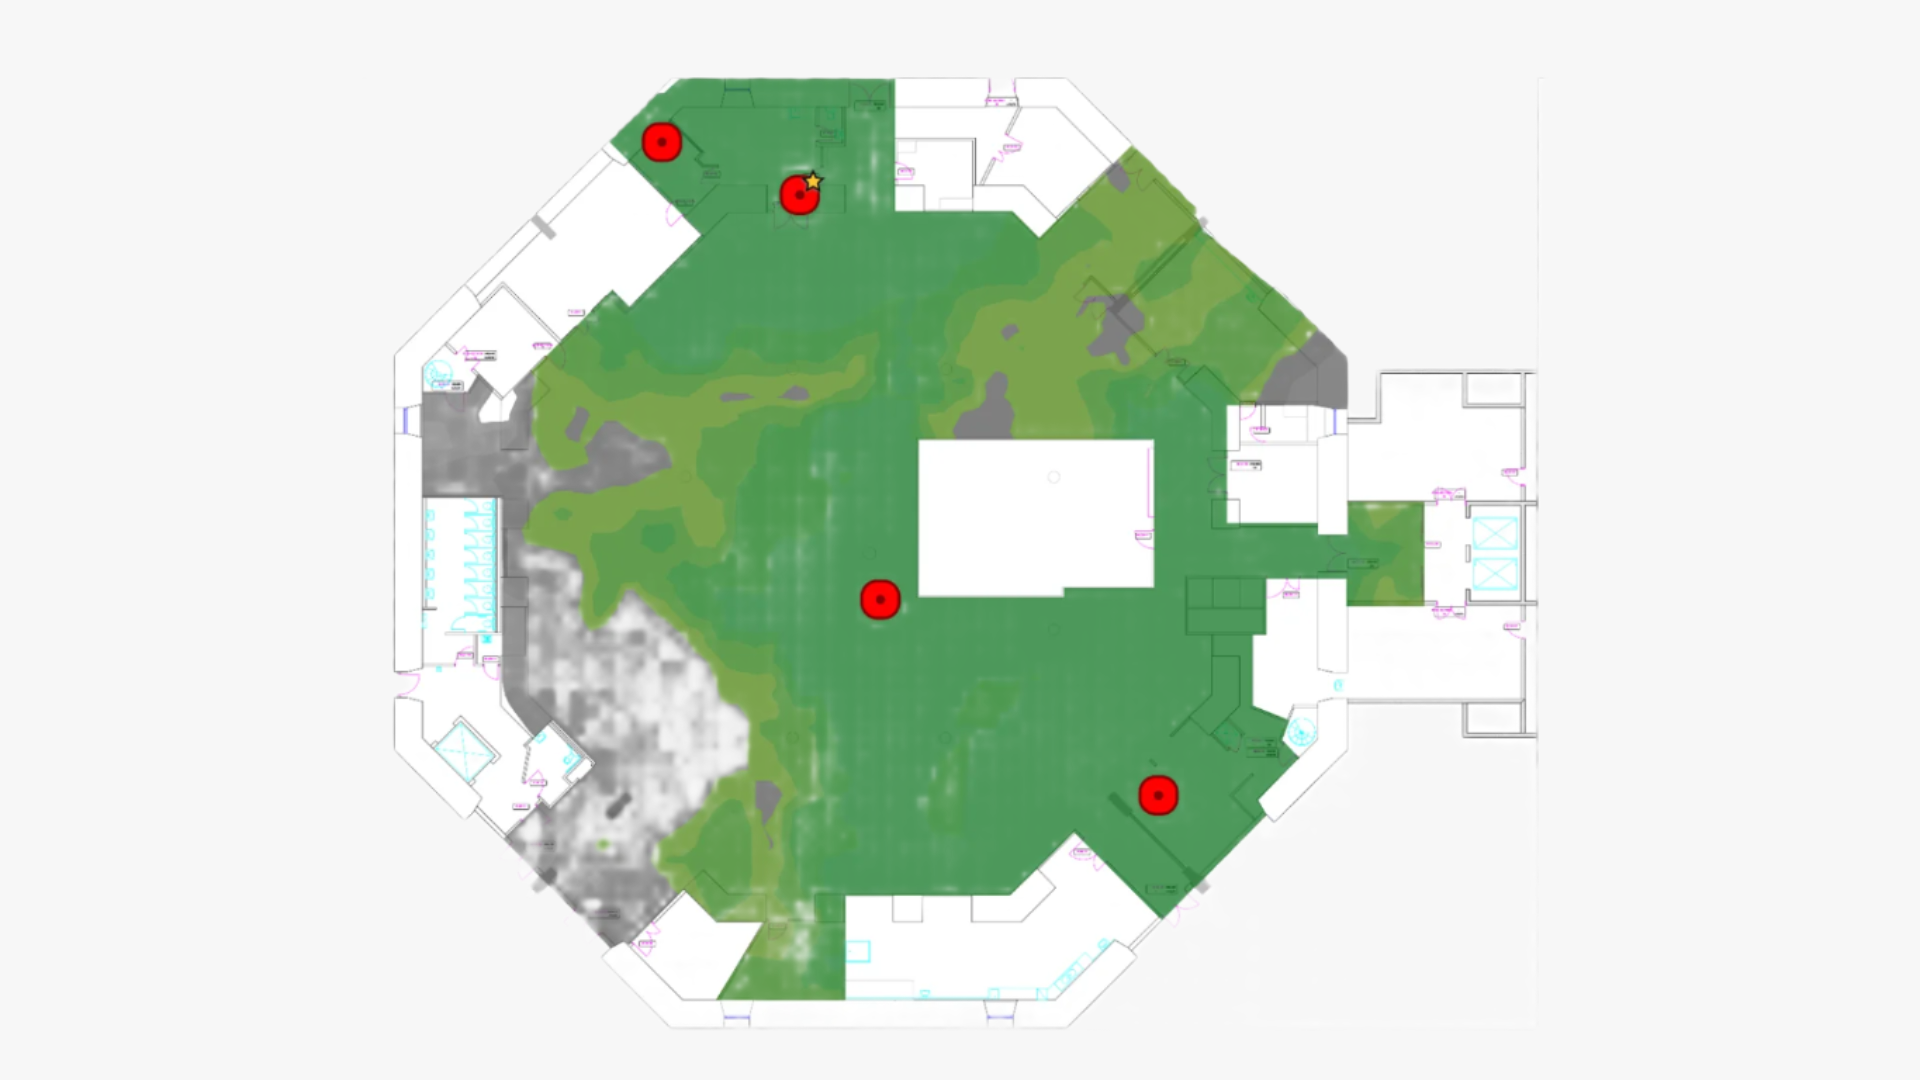
Signal-to-Noise Ratio
SNR is the difference between the signal strength and the current noise level. The higher the value (towards
green), the better the client adapter's ability to communicate with the Access Point. Low SNR is also a factor
contributing to low data throughput.
Data Rate
The Data Rate map below shows the predicted speed
at which the client device and the WAP are communicating. The higher the value (towards green), the better
the client adapter's data rate transmission with the access point.
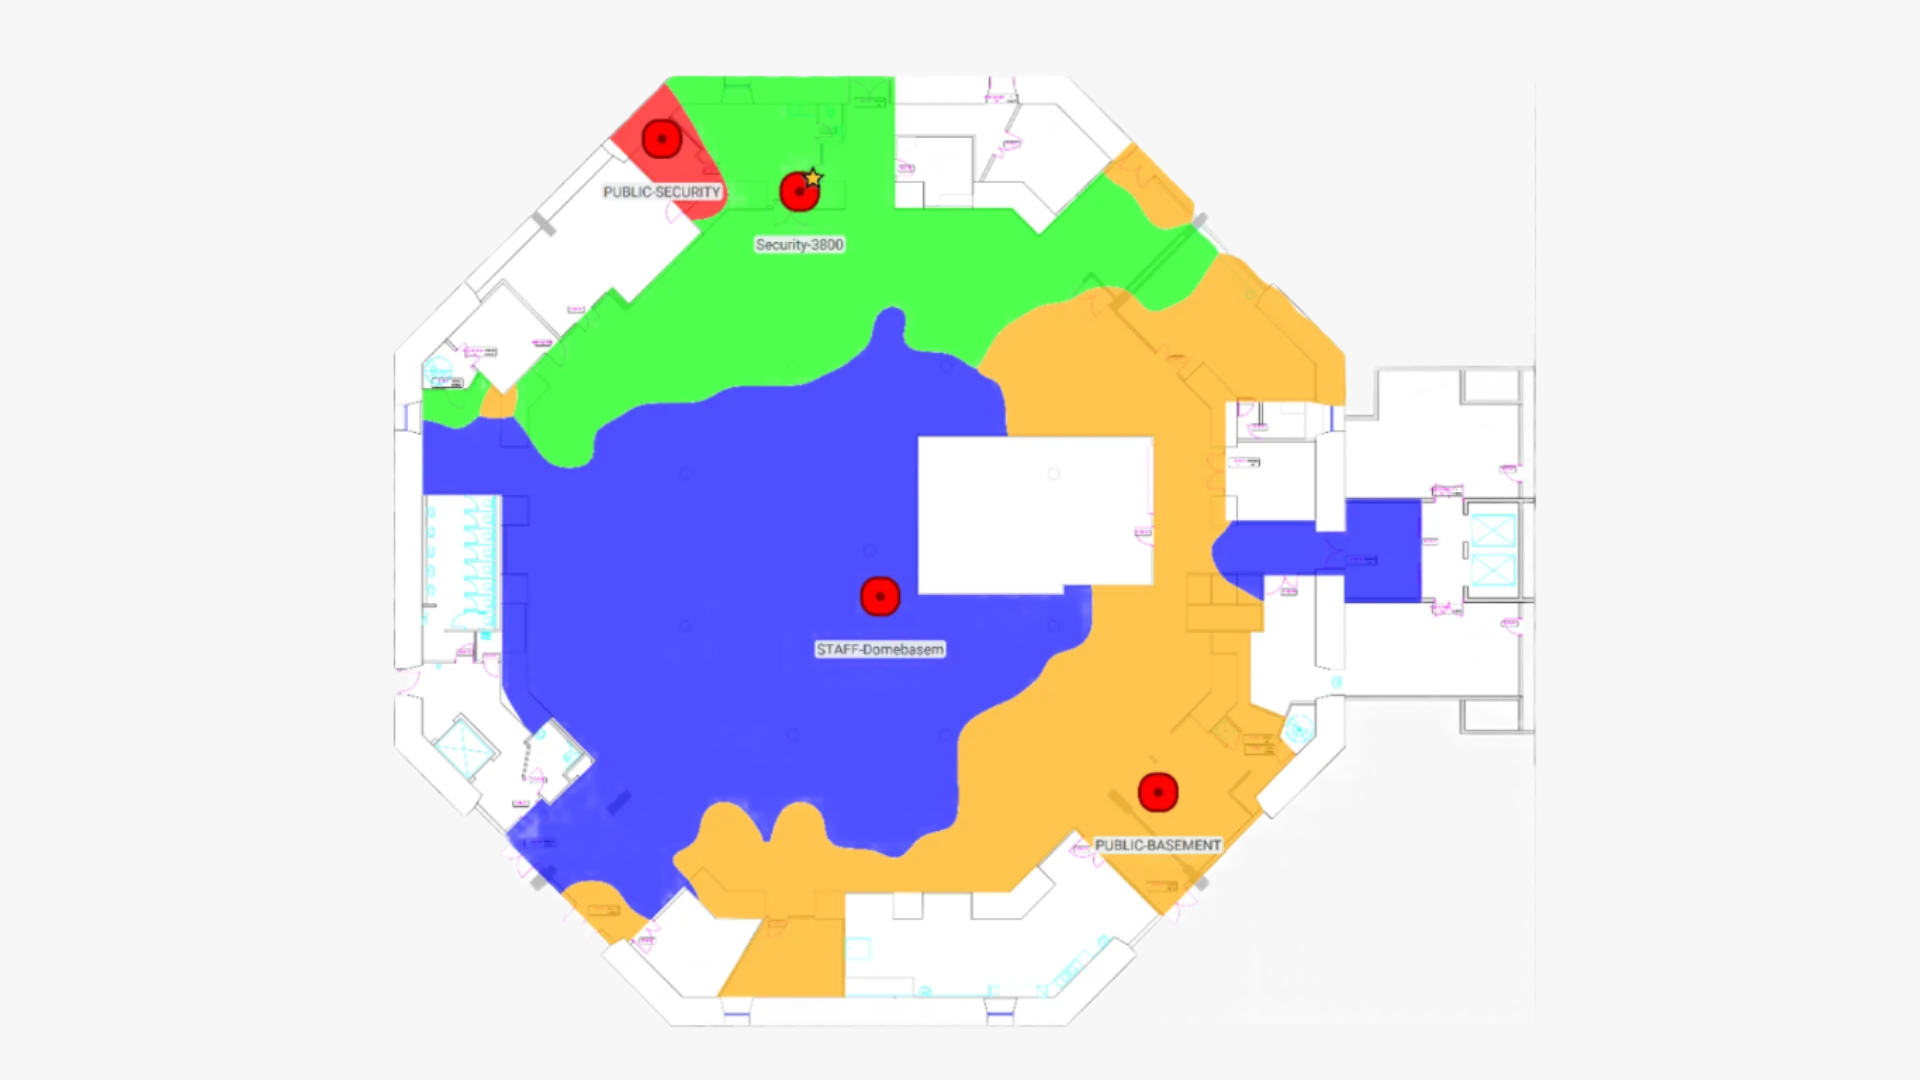
Associated Access Point
The associated access point cell size is measured throughout the survey, which is useful in determining sub-optimally performing WAP locations or mounting methods.
Survey Route
Identified WAPs
Signal Strength
Signal-to-Noise Ratio
Data Rate
Associated AP
Get in touch with us for additional information and pricing.