Indoor Wireless Survey

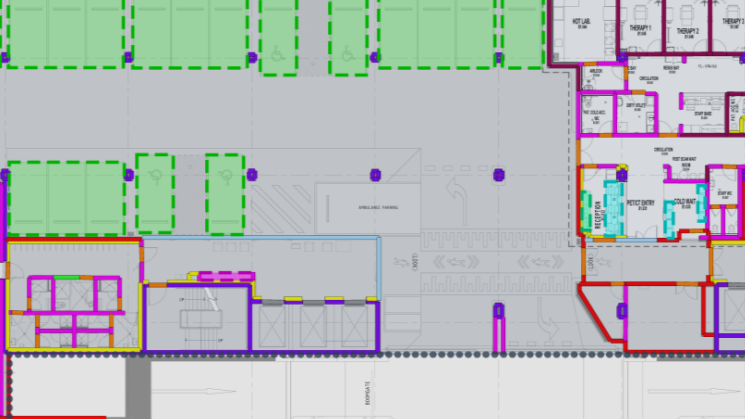
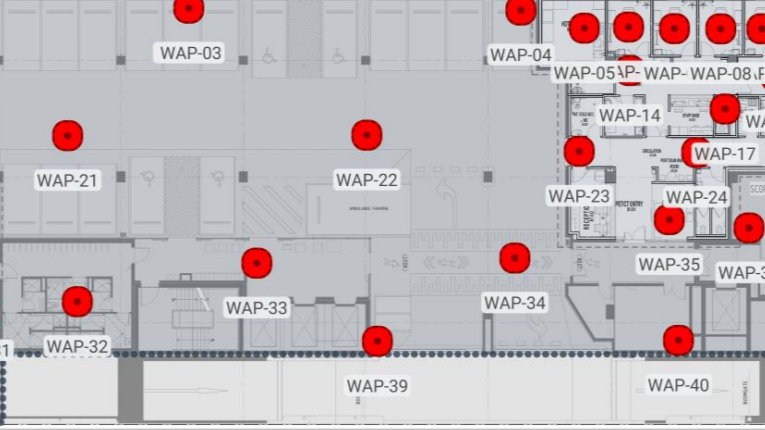
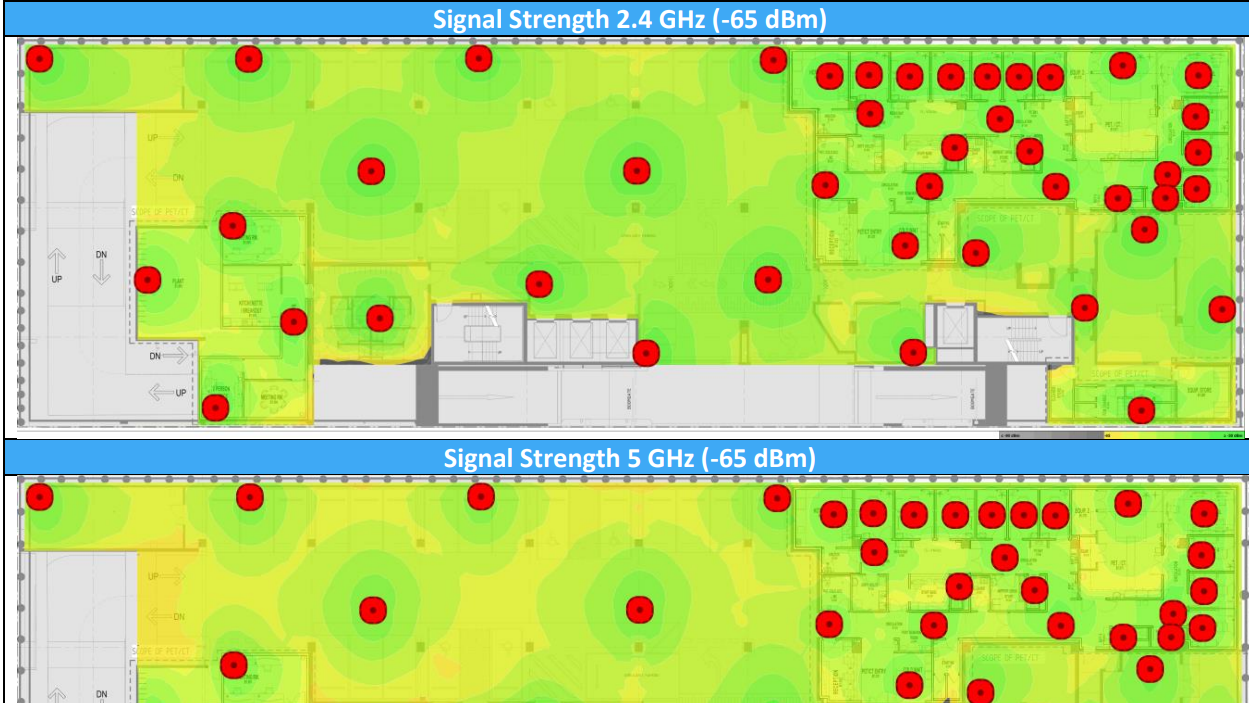
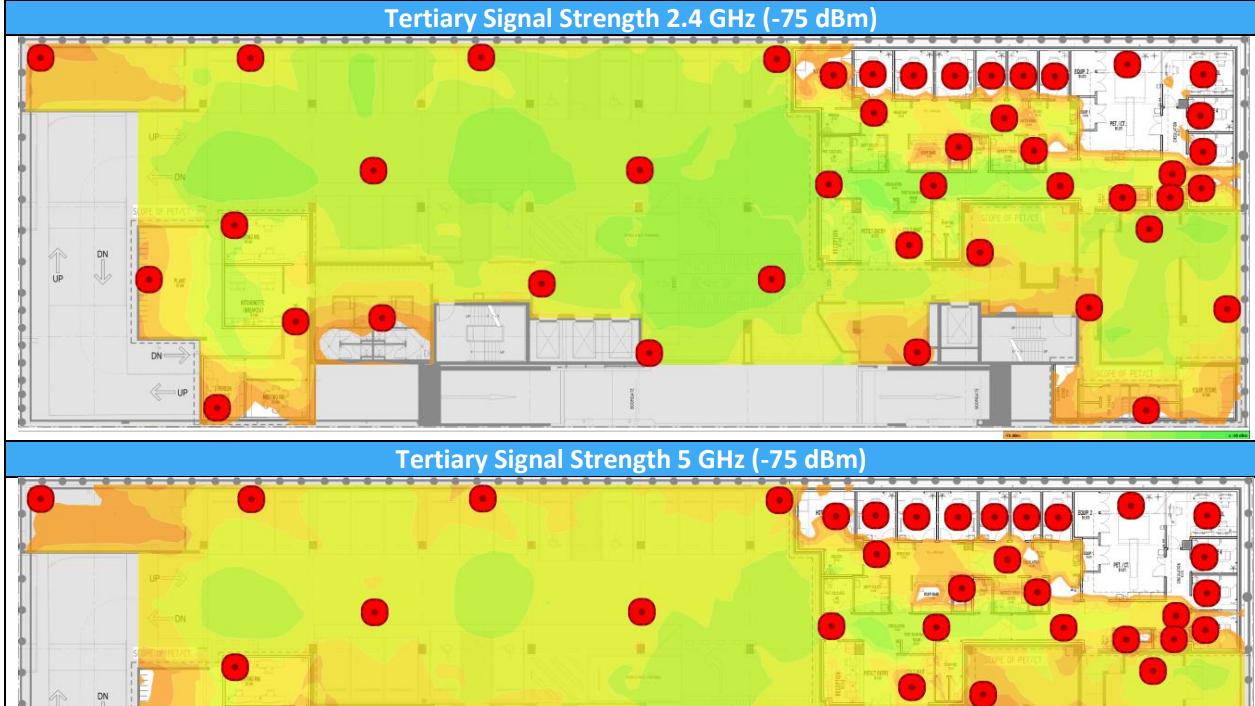
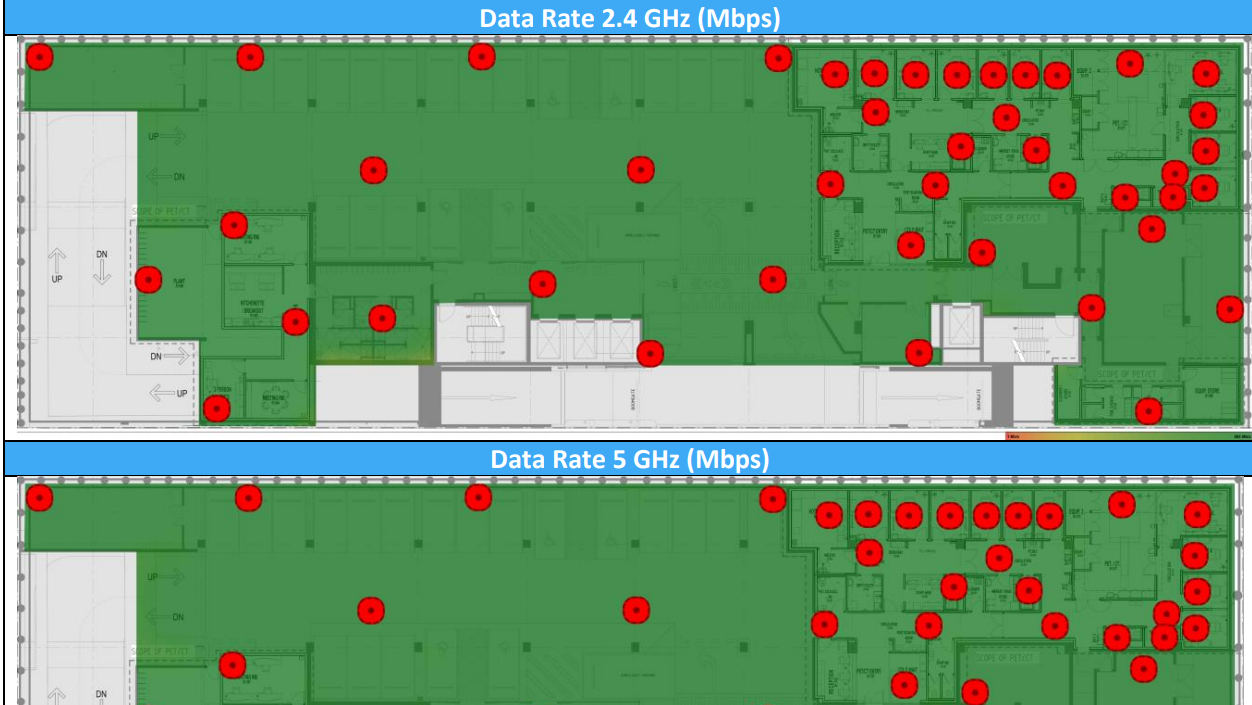
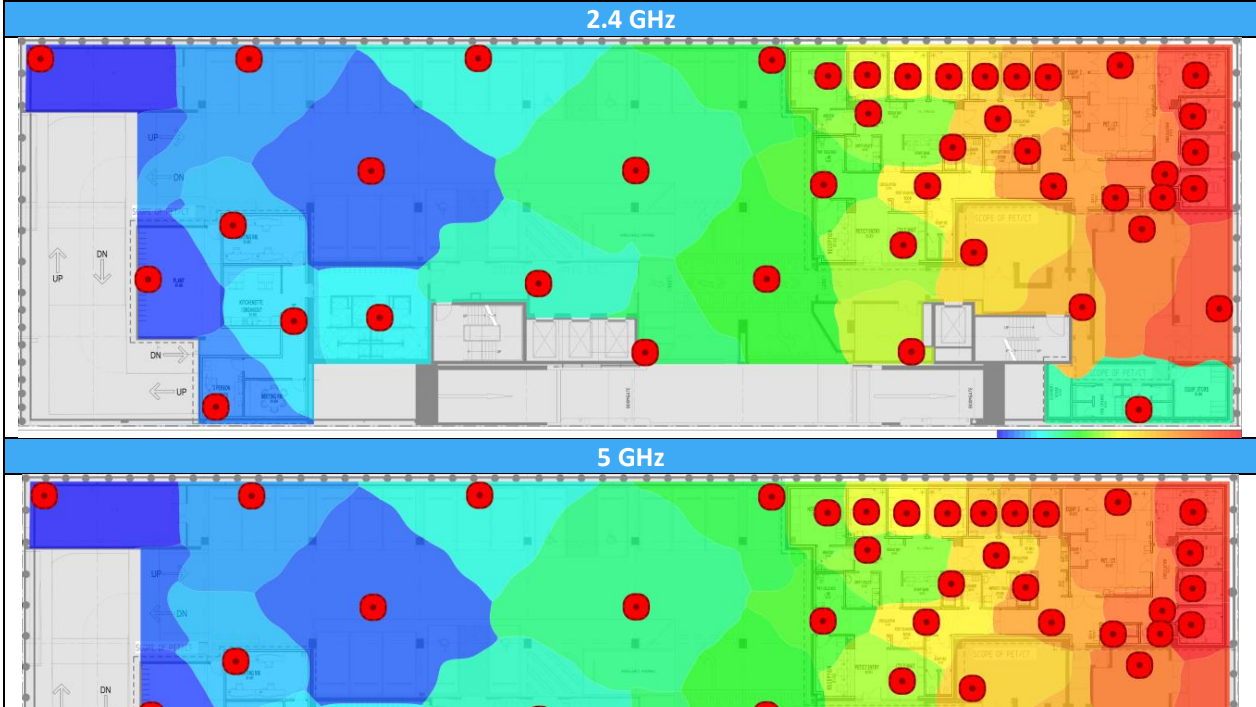
Our Engineers use Ekahau and Hamina WiFi design software to analyse floor plans (wall construction, general arrangement, reflected ceiling and elevation plans). Physical onsite inspections are performed where required to identify all building materials, obstructions, optimal access point locations, required antennas and mounting methods. We then overlay all of the parameters into the survey software, they include wall construction information, furniture plans, reflected ceiling plans, attenuation areas, access point models, antennas and transmit powers, number of users, desired data rates to provide you with the most accurate predictive wireless coverage design possible. All WAP locations are clearly identified on the floor plan and comprehensive report including a Cabling Bill of materials if required.

Wall Types and Attenuation

The Wall Types and Attenuation map documents wall construction data, obstructions, and attenuation areas to ensure accurate predictive wireless coverage design.

Proposed AP Layout

The Proposed Access Point Layout map provides a detailed visualisation of optimal WAP placements to ensure precise and reliable wireless coverage.

Signal Strength

Signal strength is a fundamental factor in wireless network performance. Weak signals can lead to unstable connections and reduced data rates. A higher signal strength indicates a stronger and more reliable connection.

Tertiary Signal Strength

For optimal location tracking and connectivity, tertiary coverage requires a signal strength of -75 dBm or better from at least three adjacent wireless access points (WAPs). Using professional wireless survey tools like Ekahau Survey Pro, we validate that all areas meet this standard, ensuring reliable real-time location services (RTLS) in line with best-practice enterprise deployments.

Data Rate

The Data Rate map illustrates the estimated communication speed between the client device and the WAP, based on signal strength. Higher values indicate improved data transmission efficiency between the client adapter and the access point.

Associated Access Point

The Associated AP heatmap displays the expected coverage area of an access point at a specified signal strength threshold. This helps identify suboptimal WAP locations or mounting methods, allowing for adjustments to improve AP placement.
Attenuation
Proposed AP Layout
Signal Strength
RTLS
Data Rate
Associated AP